Automation Map
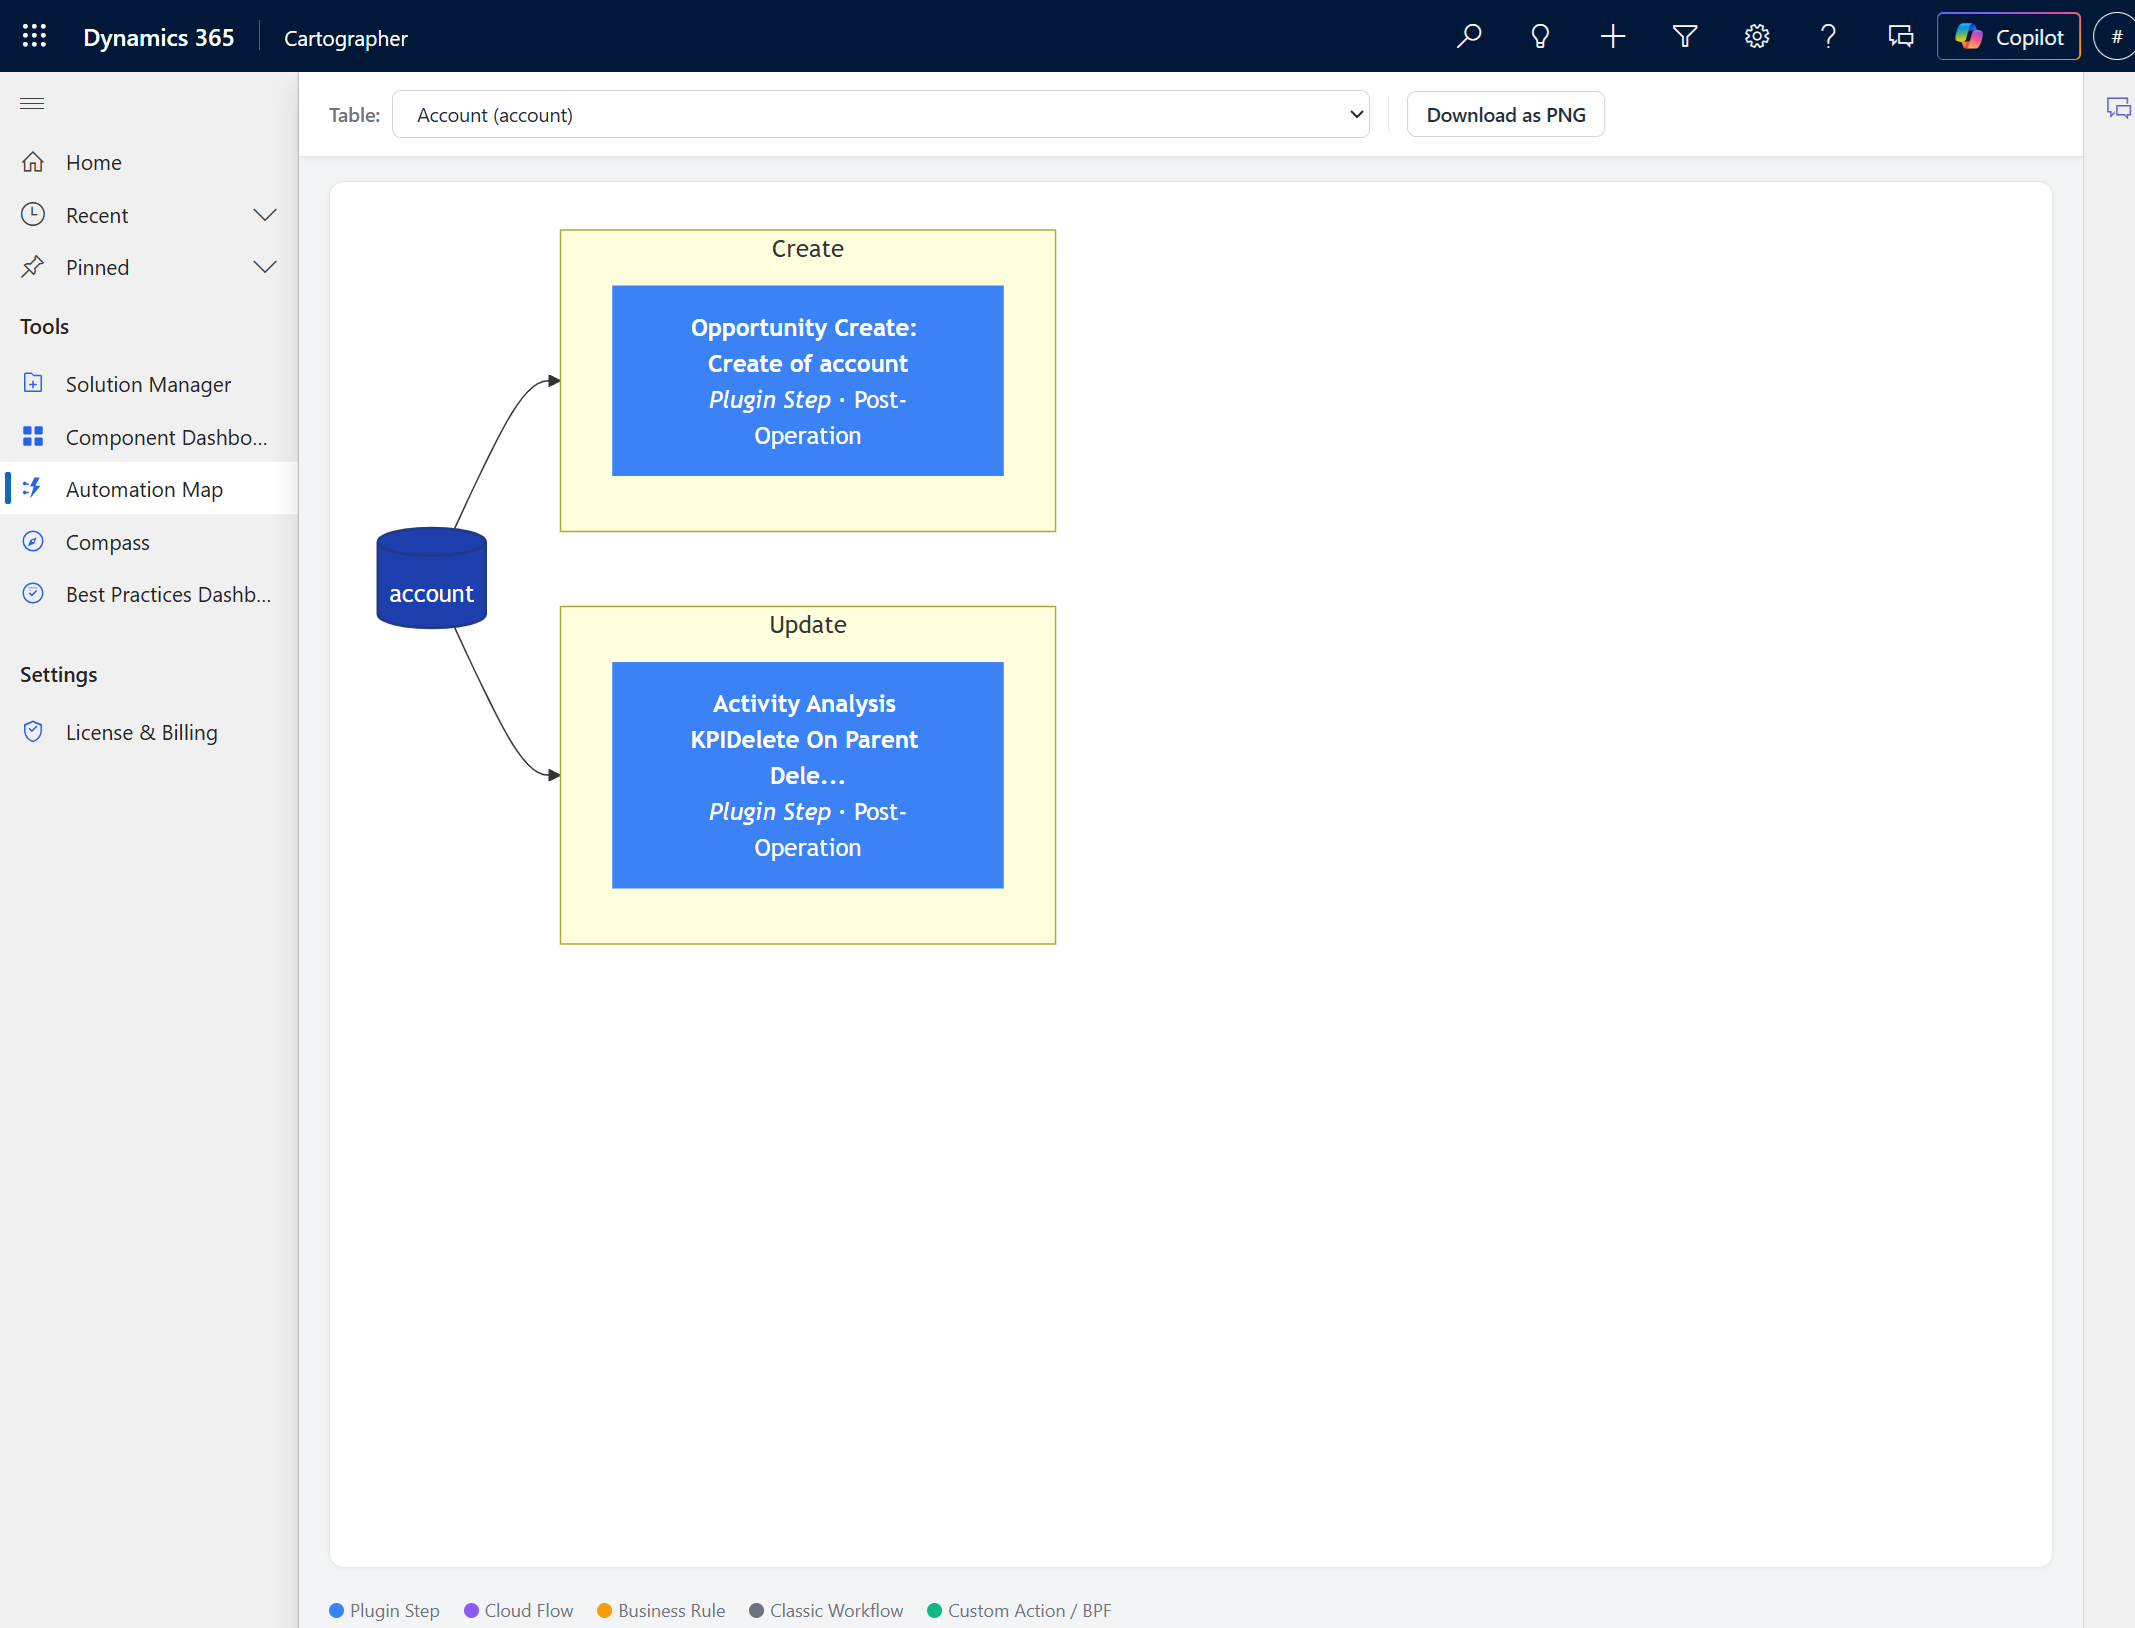
The Automation Map gives you a visual overview of every automation running on a specific table — plugins, cloud flows, business rules, and classic workflows — in a single diagram.
What It Shows
For any table in your crawled solutions, the Automation Map generates an interactive Mermaid diagram that displays:
- Plugin Steps — Pre-validation, pre-operation, and post-operation steps with stage, mode (sync/async), and message (Create, Update, Delete, etc.)
- Cloud Flows — Automated flows triggered by table events, scheduled flows that query the table, and instant flows that operate on records
- Business Rules — Client-side and server-side business rules that fire on the table, with their activation status
- Classic Workflows — Legacy workflows (if any) that fire on table events, including their trigger conditions
How to Use the Automation Map
- 1
Navigate to Automation Map
In the Cartographer app, click Automation Map in the left sidebar.
- 2
Select a table
Use the table dropdown to select which table you want to visualize. If the table has no entity-bound automations, the page says so plainly instead of drawing an empty diagram.
- 3
View the diagram
The Mermaid diagram renders automatically, showing all automations connected to the selected table. The table sits in the center with automations branching out by type and trigger.
- 4
Interact with the diagram
Hover over any node to see additional details. Click a node to open the component's detail panel where you can view the full metadata and summary.
- 5
Download as SVG
Click the Download button in the toolbar to export the diagram as an SVG file. SVG scales to any size without losing quality and drops cleanly into a Word document or a PowerPoint slide — a PNG export isn't possible given how the diagram is rendered, and SVG is the better format for line art anyway.
Color Coding
The diagram uses consistent color coding to help you quickly identify automation types:
Diagram Caching
Automation Maps are cached per table per solution in the Entity Diagram table. When you first view a table's automation map, the Mermaid diagram code is generated and stored. Subsequent views load instantly from cache.
The cache is automatically invalidated when you re-crawl a solution, ensuring diagrams always reflect the latest state of your environment.
Common Use Cases
Onboarding new developers
Show new team members exactly what automations fire on each table. No more "I didn't know that plugin existed" moments.
Debugging unexpected behavior
When a record update triggers unexpected side effects, the automation map shows every piece of code that fires on that table.
Architecture reviews
During code reviews or architecture assessments, use the map to evaluate automation density and identify over-automated tables.
Documentation for stakeholders
Export the diagram as SVG and drop it straight into project documentation, architecture decision records, or a client deliverable in Word or PowerPoint.